Maps

On this page are a few past projects I did with the team at Chôros Lab (EPFL) in Lausanne. I am specifically interested in making readable the urban pattern of political spaces.
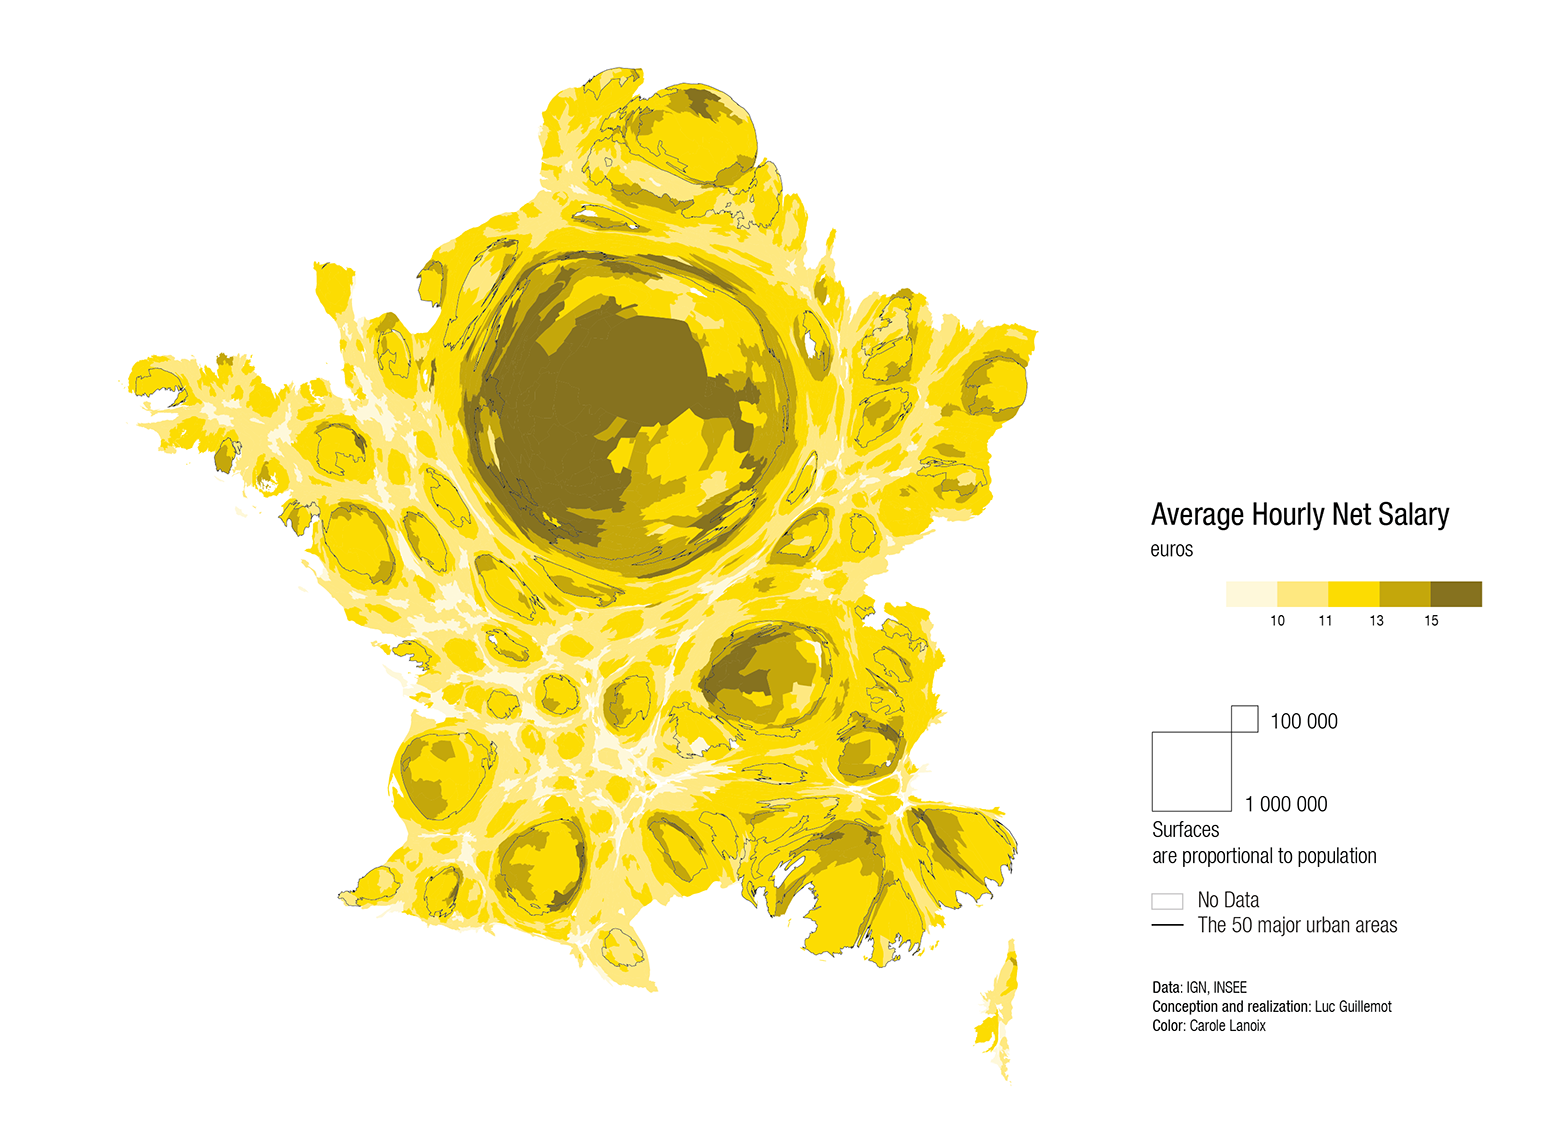
The Urban Pattern in France
Socio-spatial characteristics of French population reveals levels of urbanity. Socio-spatial indicators are mapped at the communal level using a population cartogram. Most indicators make obvious the urban pattern covering the entire territory of France. City centers almost always contrast with their suburbs and hinterlands. The use of cartograms make their specific urbanity readable. These maps have been published in Jacques Lévy's Réinventer la France.
Wealth Education Laborers Active Population Tourism Gender equality Bachelors Car-free households Urban zoning
2012 US Election
This map is part of an analysis of US 2012 general election that depicts the urban network of Barack Obama electoral body: city centers lean more democratic than their outskirts and suburbs.
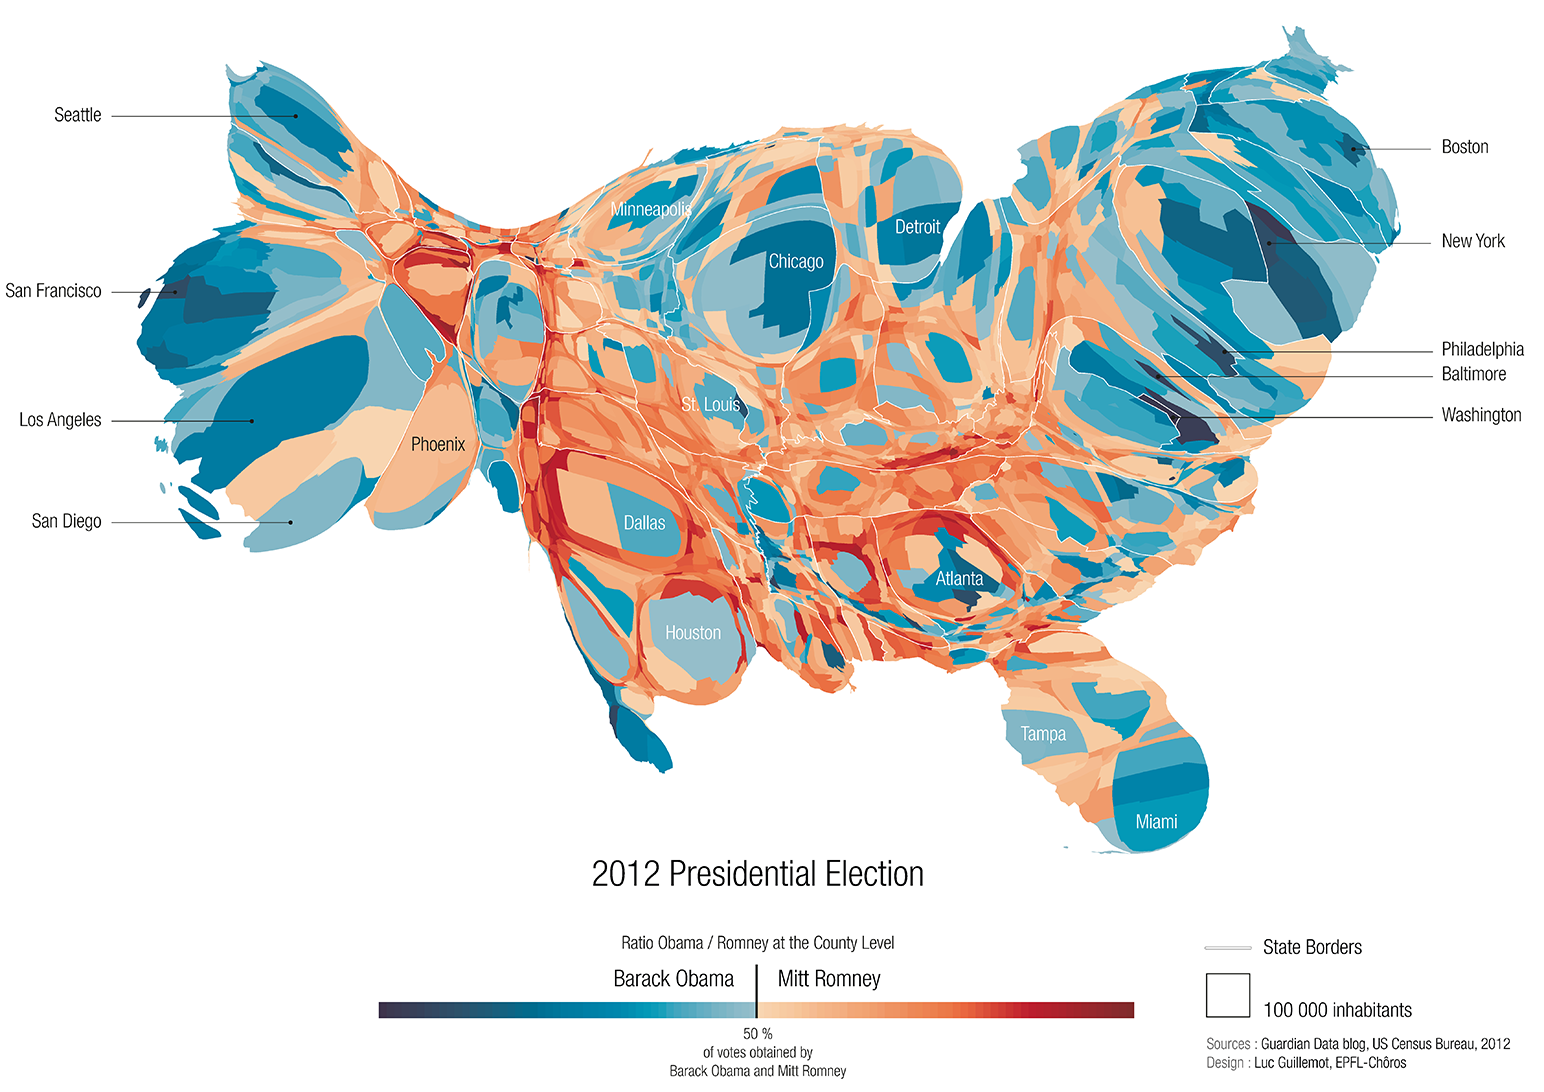
Spatial characteristics are more relevant than socio-economic features to distinguish Romney and Obama’s electoral bodies. A cartographic representation at county level that uses a population cartogram as a base map makes the opposition between both geographies obvious. As in 2008, big cities and other places interfacing with the outside world favored Barack Obama, whereas outskirts and small cities primarily voted for Mitt Romney.
This spatial dichotomy is not surprising considering the parties’ opposing views on the idea of society: whilst the Democrats support the idea of a society of individuals linked by solidarity, the Republicans remain based on the idea of communal groups knit by conservative norms. Obama’s geography, as well as the reforms he carried out as president, show that he is the candidate for those who reject the moral order supported by the Republicans and those who want to establish post-communitarianism in the United States of America.
This article has been written with Jacques Lévy and has been published in the journal espaces-temps.net.
A Dynamic Mapping of Time Accessibility
Commuting Scales is an interactive map depicting the commuters space of Lausanne University Campus, using several metrics.
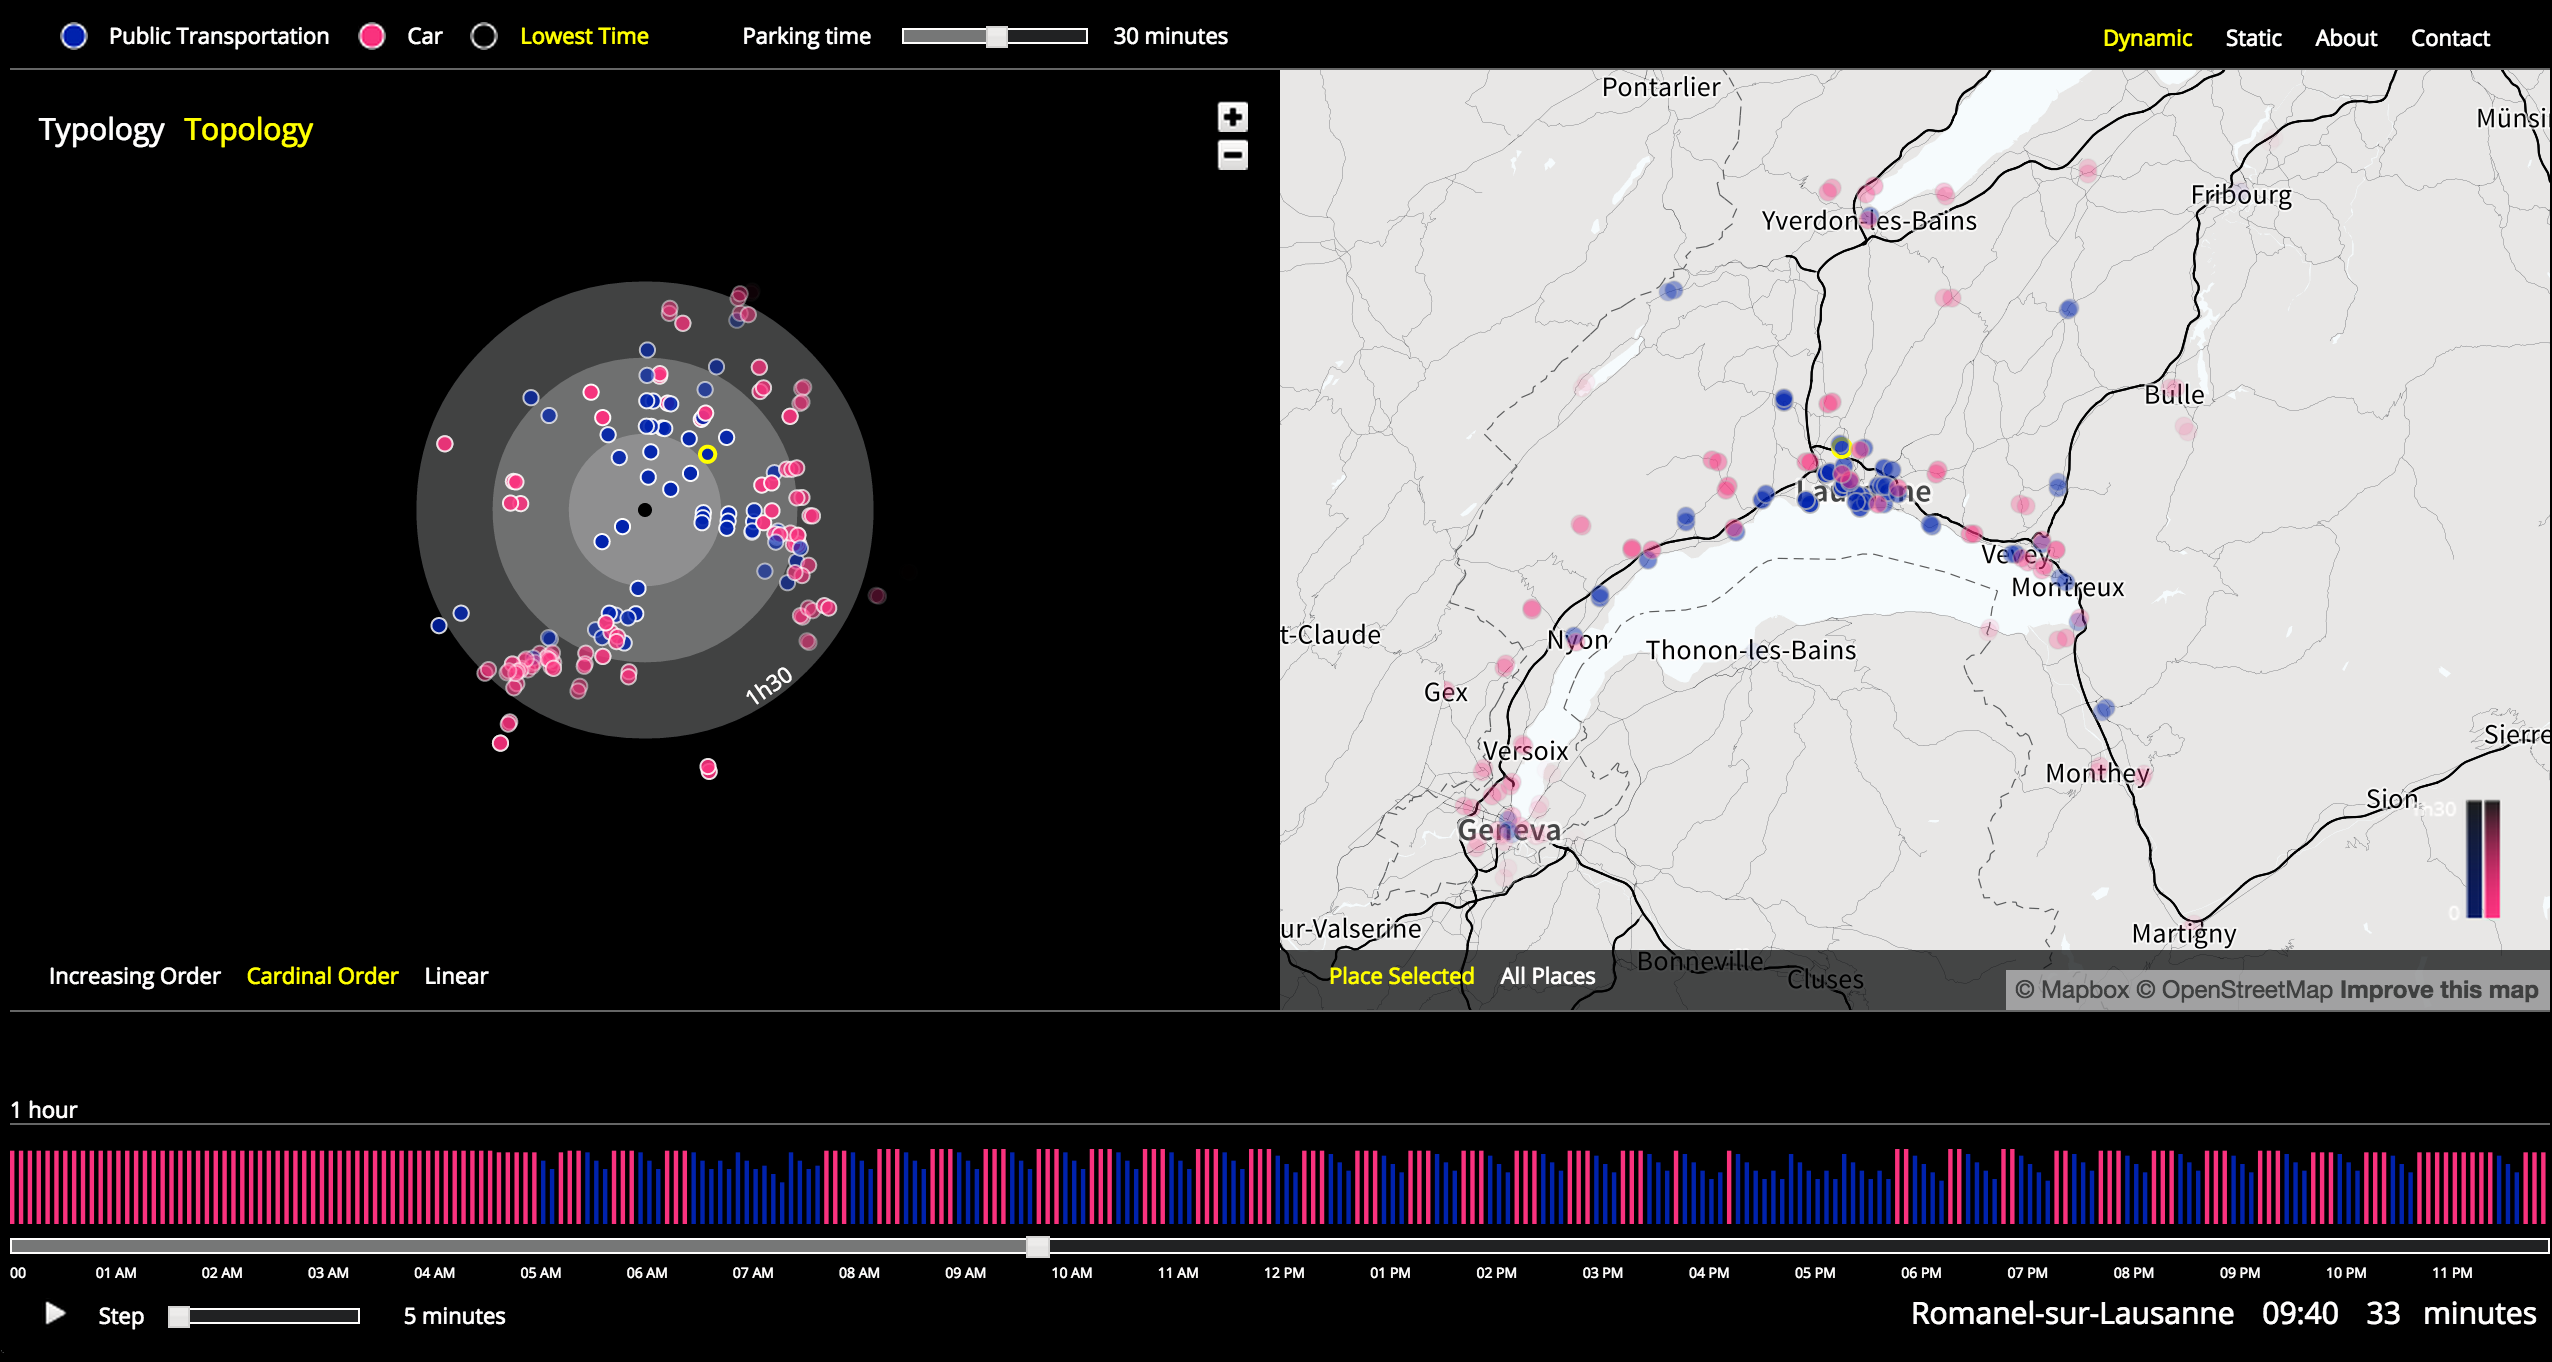
Visualization tools are crucial to facilitate access to complex spatial phenomenon. This is what the application “Commuting Scales” aims at demonstrating. As an example of such a complex phenomenon, the addressed question is that of the commuters’ space of the university campus of Lausanne, Switzerland. Dealing with traveling times and mobility choices through a day, the application aims at defining which are the scales and metrics of the space that the many users of the campus cover every day.
To reach this purpose, two main geographic metrics are used : that of the euclidean space and that of the time space. The produced images display an objective piece of information : time travel between two places. They are meant to set off a discussion on more complex and subjective features of mobility, such as perceived time, wellbeing, travel costs, etc. By changing the content of the cartographic analogy, it aims at giving to the map its inherent heuristic power, which consists in making readable a complex space, and giving a space to look at, in order to understand the role of topologic transportation systems, the role of distance or the motivations of users.
Public policies regarding mobility emphasize the need of a modal shift from car transportation to public transit. Campus commuters use significantly more public transportation than car, which constitutes a first unordinary situation in Switzerland.
The application Commuting Scales shows that, considering travel times, there is a huge gap between the two transportation means, in favour of car transportation, which constitutes a second paradoxical situation. This gap is mainly due to public transit’s low frequencies. Changing the content of the cartographic analogy allows different visualizations to facilitate the depiction of these issues, and raises the idea that mapping a space participate to its creation by emphasizing its paradox. The cartographic application gives a new base ground for debate on mobility. It raises in particular the idea that mobility is not just about travel time but faces other challenges.
The “modal shift” towards pubic transit is already accomplished for the biggest part of commuters, despite the advantage of car transportation. The majority of these commuters may be students, who are not the richest part of the population. But here is a hiatus that should be the starting point of public policies design. The idea that car is still rooted in young swiss citizens lifestyles is outdated. Public policies are ambiguous because they encourage people to use a less efficient mobility mean, when they should acknowledge the fact that this “modal shift” is accomplished and should improve the efficiency of public transportation to prevent students from returning to car transportation.
This application is a common work with Boris beaude. The application is powered with d3.js, Mapbox, JQuery and JQueryUI. It can be viewed here. Data have been crawled from the CFF (Swiss federal railway agency) and TomTom websites.
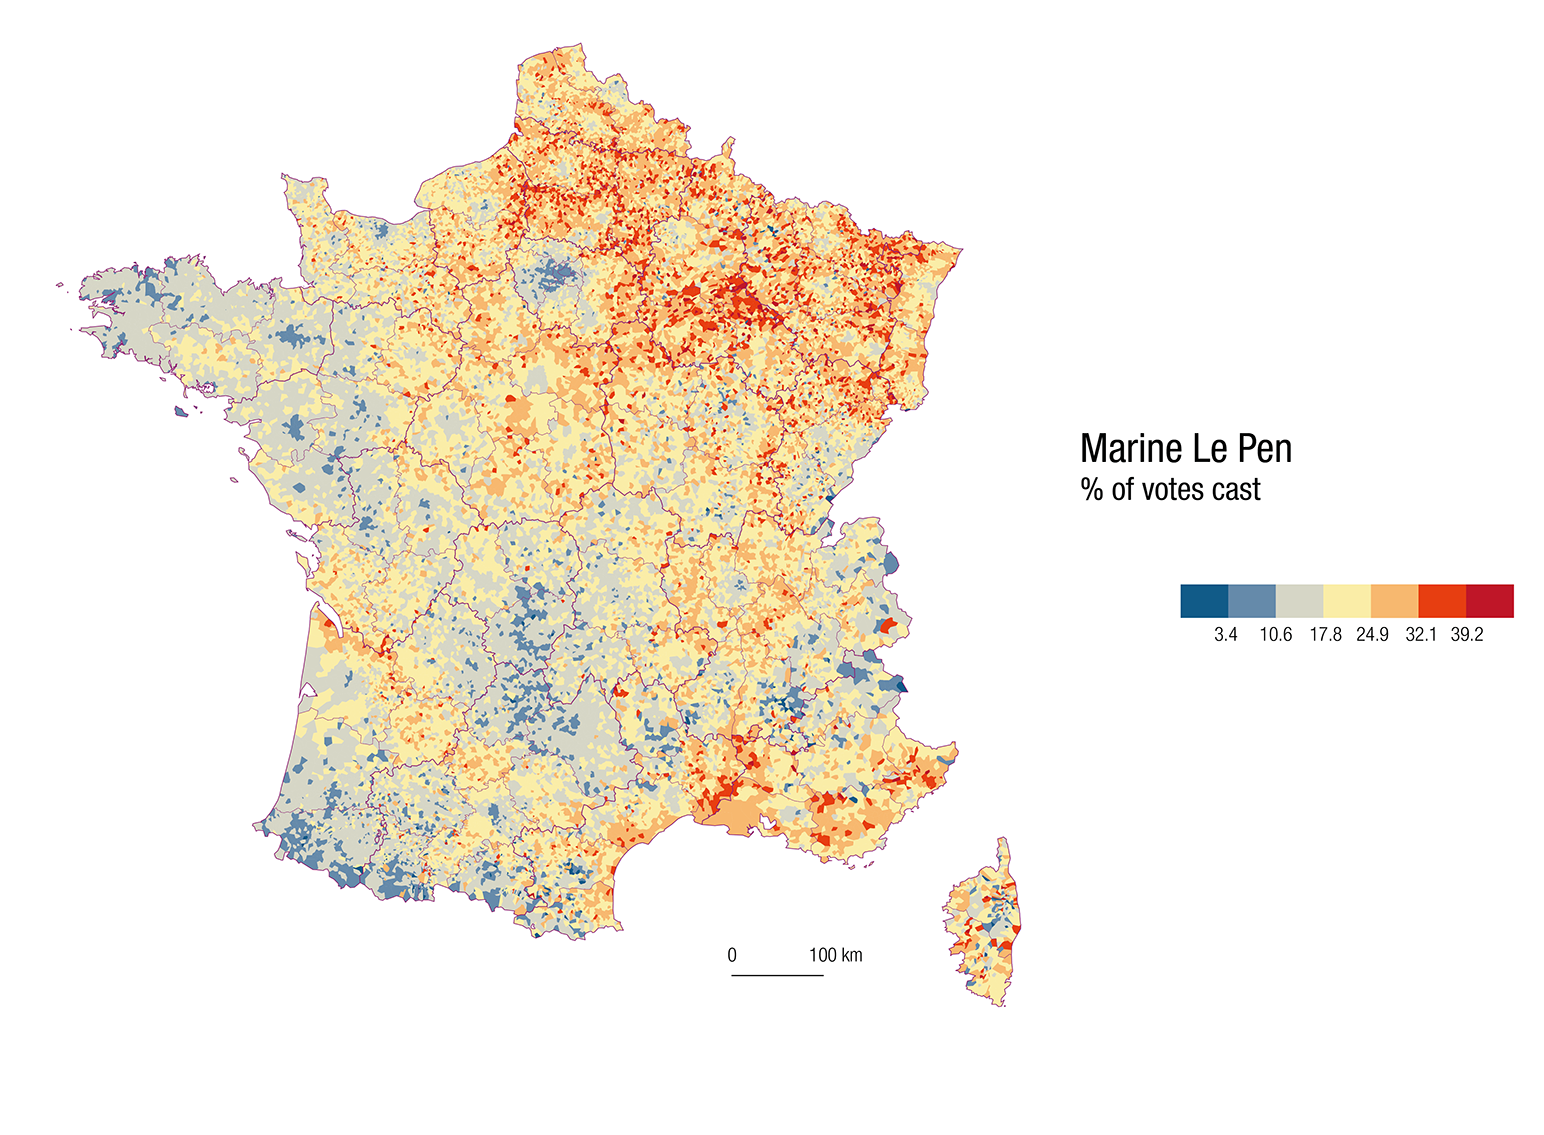
2012 Presidential Election in France
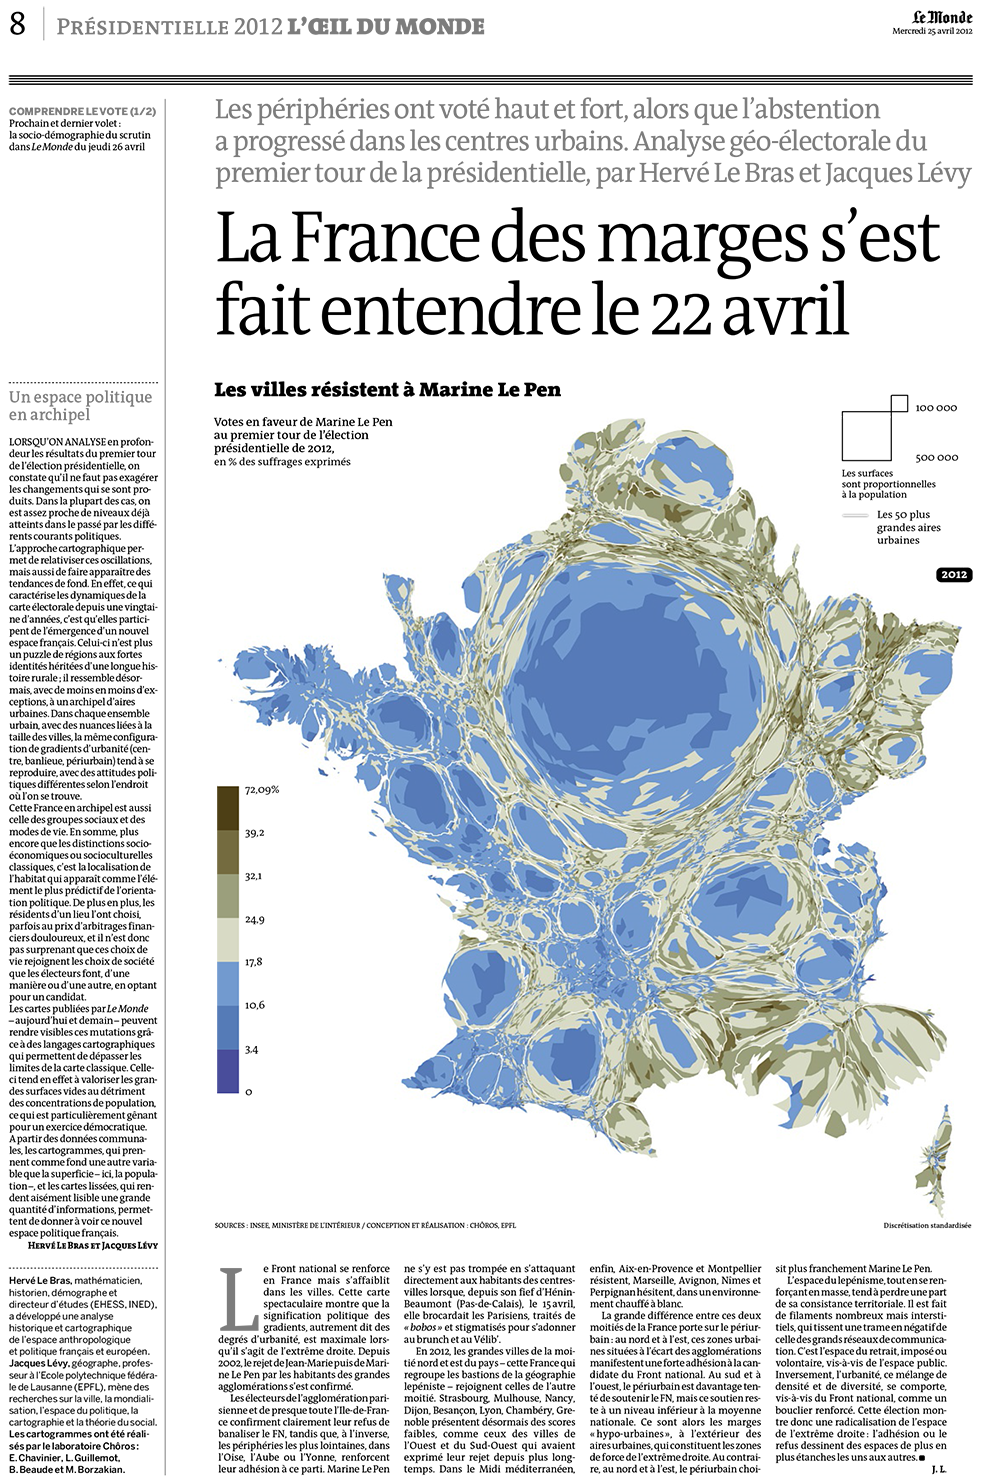

Vote casts in 2012 French presidential election follow an urban pattern. The map of the far-right party “Front national” (Marine Le Pen) emphacizes the prevalence of suburbs in the contribution to its good results. The immigration rate at the municipal level is spatially non correlated to municipalities where the National Front scores: city centers have the greatest immigration rate and the lowest far-right votes, Paris in particular. This observation is also valid regarding the “blank votes” map that underlines the prevalence of suburbs in the expression of an anti-establishment vote.
Some of these maps have been published in the newspaper Le Monde the day after the election.
These maps have been realized with Chôros Lab. cartographic Center (Elsa Chavinier, Jacques Lévy, Boris Beaude and Manouk Borzakian).
First round : Marine Le Pen Migrants Second round : François Hollande Nicolas Sarkozy Abstention Blank Votes
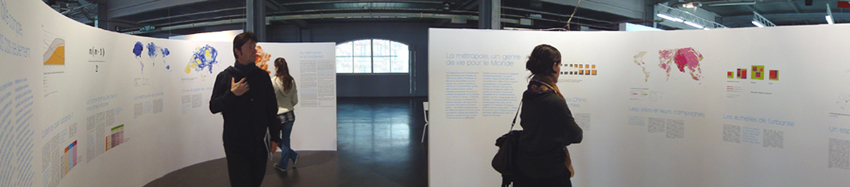
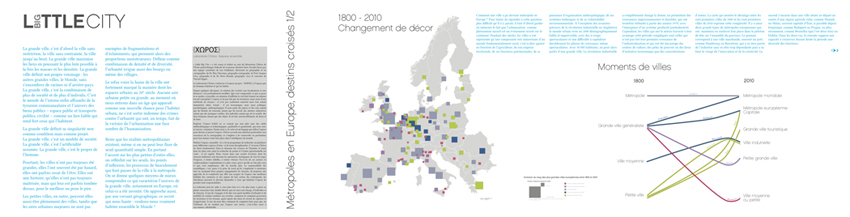
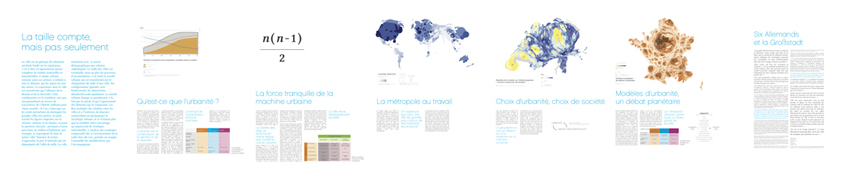
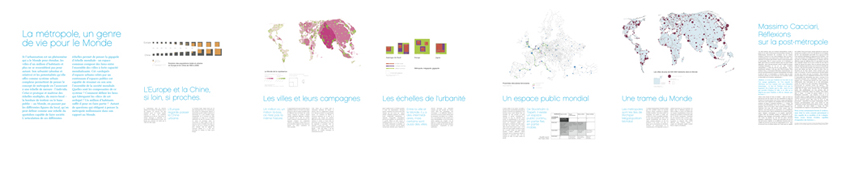
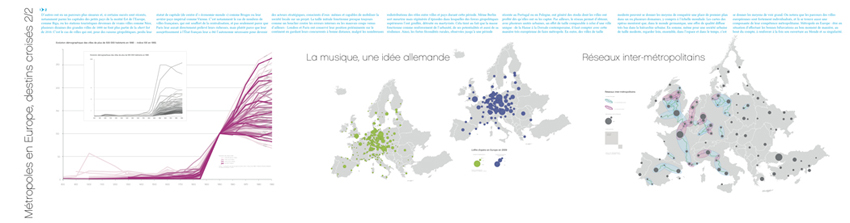
Little Big City
These panels are part of an exhibition performed at the 2010 Biennale for Architecture, Design and Urbanism in Bordeaux, France. Millionnaire cities and their role in globalization were the addressed questions. I produced this exhibition together with Elsa Chavinier, Jacques Lévy and Boris Beaude and the architecture bureau l'AUC.